
I’ve created a Quick Start guide for the jirametrics tool.
The problem with a tool that’s highly customizable is that it can be hard to get that first report up and running. This quick start is intended to get you from ‘nothing installed’ to having your first report in a matter of minutes. Then once you have that first report, you can start to tweak and customize it to better reflect your own environment.
If you’re thinking “what even is this tool?”, it’s intended to pull useful and actionable metrics out of Jira.
Jira has all kinds of good data stored internally, yet the few charts that it exposes are underwhelming at best, and actively misleading at worst. This tool give you access to much better charts than what you can get directly out of Jira.
An example…
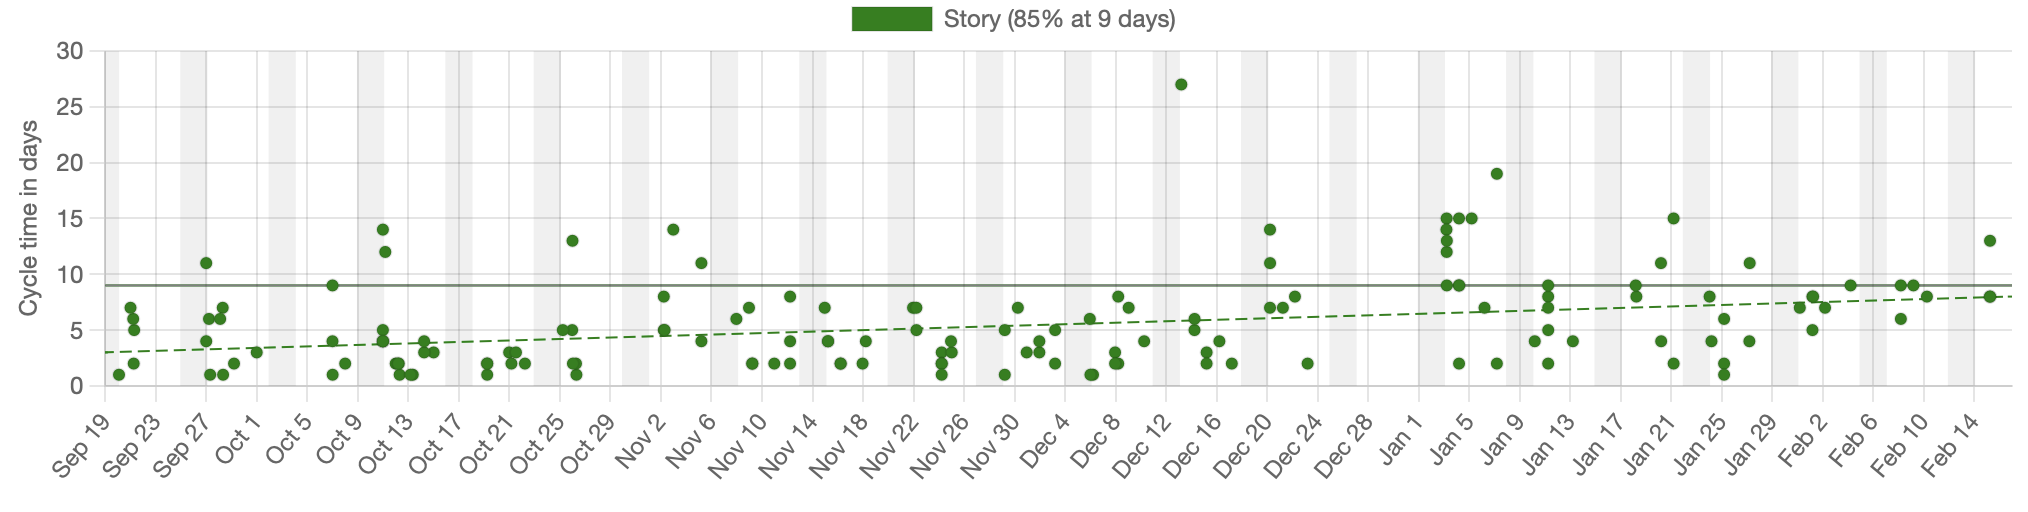
Try it out!