
I’m playing around with visualizing flow efficiency in my JiraMetrics tool. Flow efficiency is the percentage of time that we’re actually adding value to the work item divided by the total time. So if a ticket is open for 10 hours but in that time we only spend 2 hours actually working on it then the flow efficiency would be 2 / 10 or 20%.
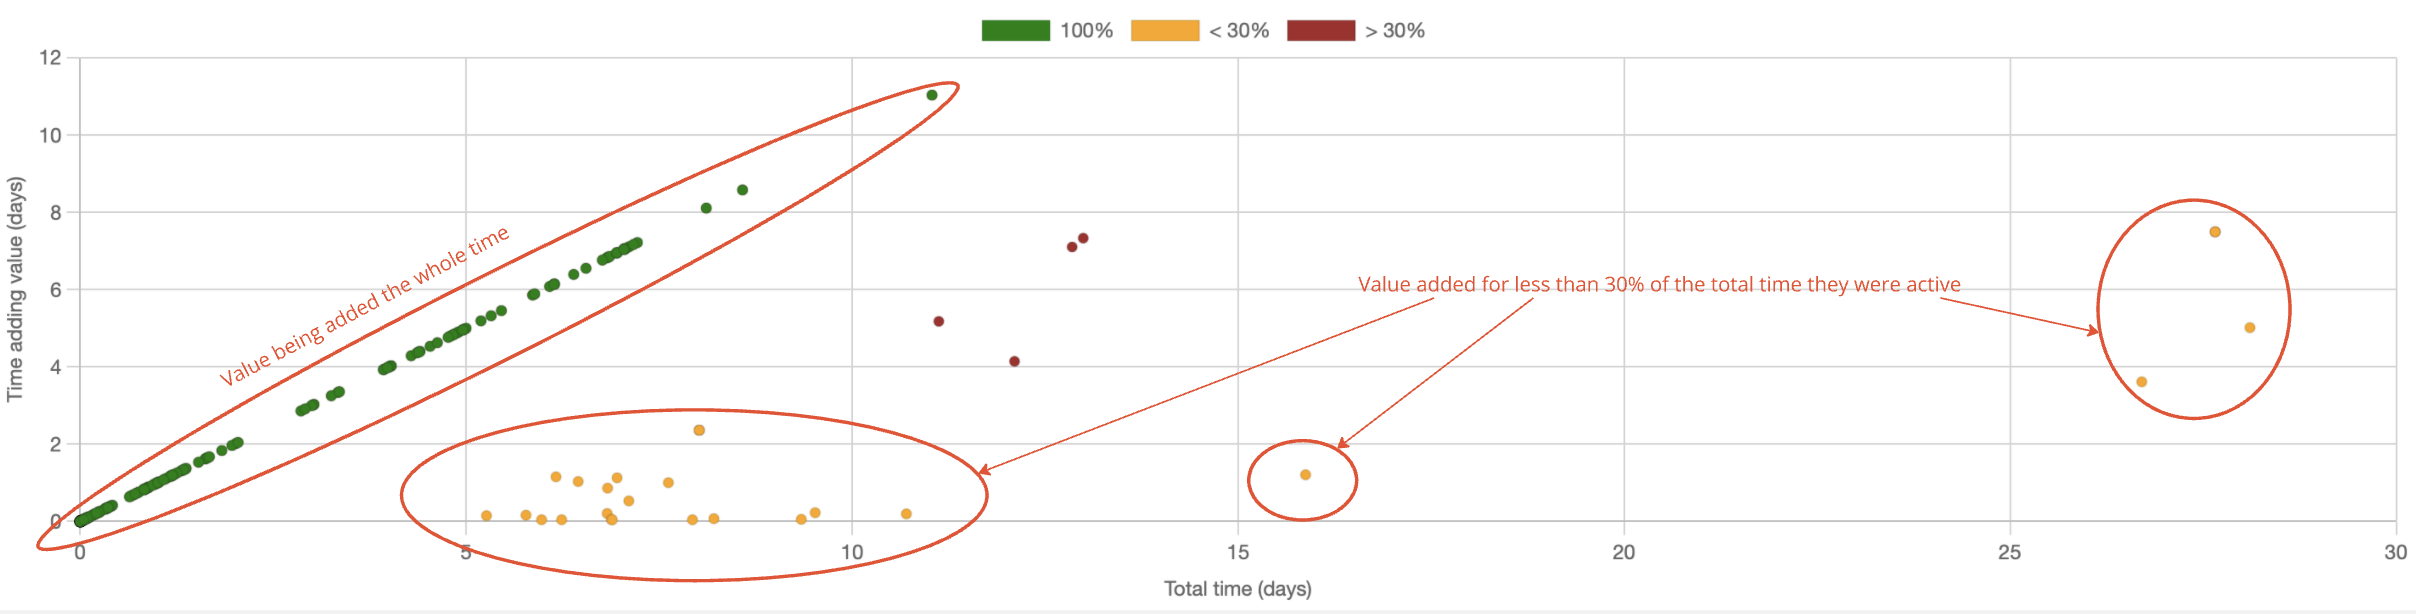
When I’m graphing the time we were adding value against the total time the work took to get done, we can see that there are three distinct types of items.
- There are those with 100% flow efficiency, which the data tells us were unstoppable. We were adding value for the entire time they were in progress.
- Items for which we were adding value for less than 30% of the overall time. This accounts for most of the items not in #1.
- The remaining outliers
The chart shown here is fairly typical for the data that I’ve looked at so far. There are a large number of items with 100% flow efficiency and a large number that have less than 30% flow efficiency and then a few outliers in between.
What can we conclude from the data so far? If an item is going to get blocked, it’s going to be blocked a lot. There are very few cases where an item gets blocked just a little bit, so it’s in our best interest to ensure it doesn’t get blocked at all.
We’ll see if this pattern holds as I start to look at more data.
Note that this is not a chart that is released. This is me experimenting with different ways to display data.
How did I collect value-add time?
Multiple people have asked how I collected the time that was adding value.
JiraMetrics allows multiple different ways to specify whether an item is blocked (something is preventing us from working on it) or stalled (we don’t have time/capacity to work on it). Any time that is not either blocked or stalled is considered to be time adding value.
For example, blocked might be indicated by the Jira flag or by a dedicated status or by a link to another issue that’s “Blocked by”. It all depends on how you’ve chosen to configure your board.
How accurate will this really be? That depends entirely on the way the board is configured and on how consistently the team updates the board. For some teams, this will be extremely accurate and for others it might be useless.