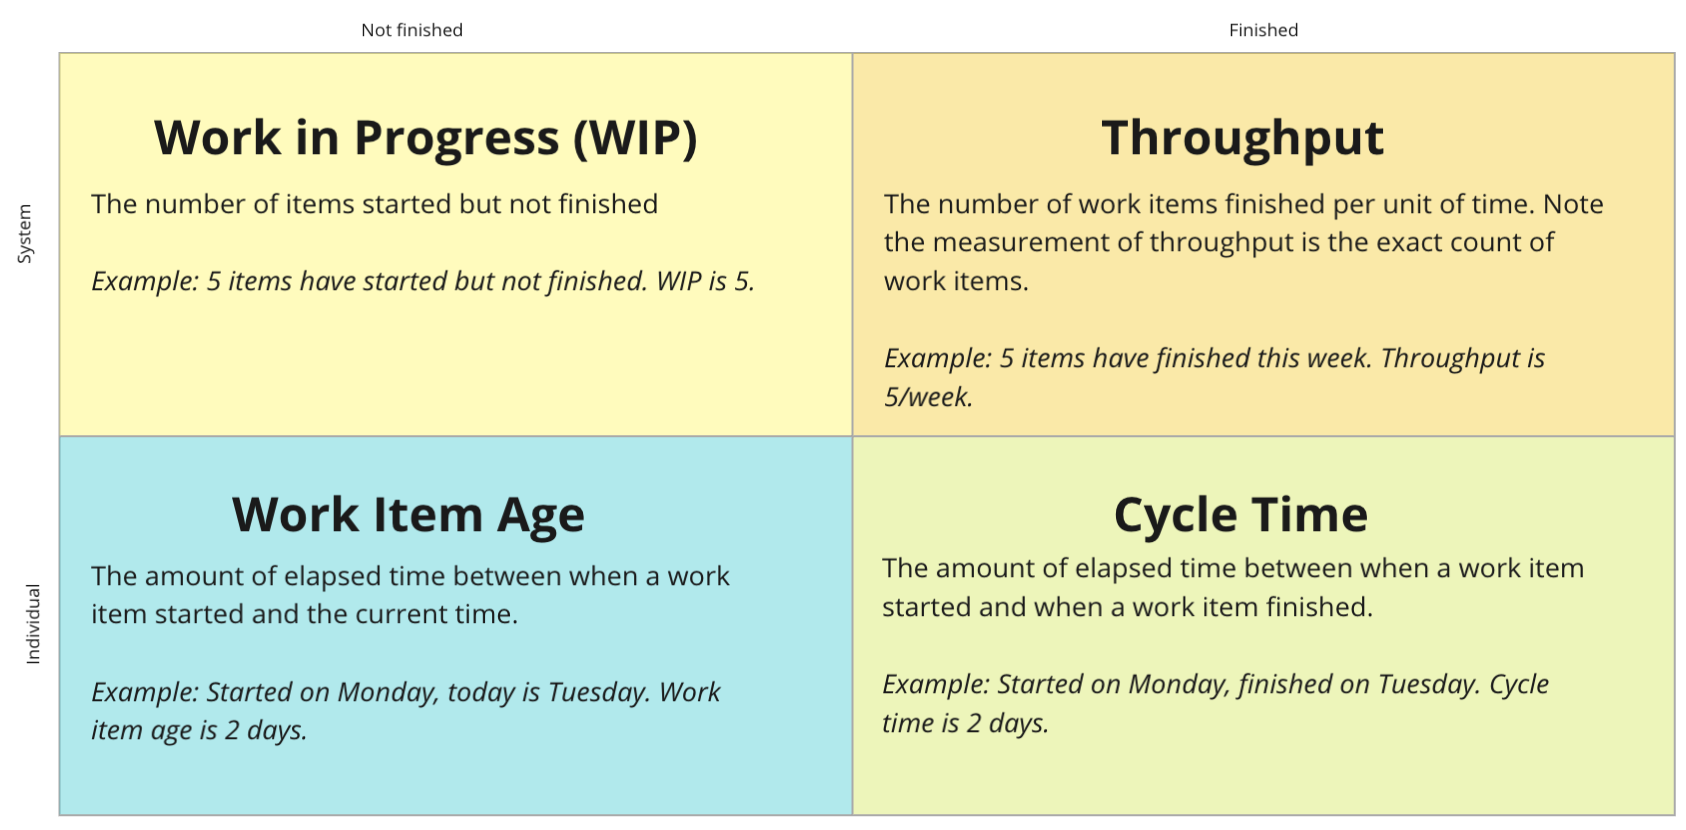
Flow metrics tell us about the activity in the system; how well is the work flowing. These are often the first metrics that I consider when trying to improve a system. I start here partially because these metrics are easier to collect than many others, and because I can still make many effective decisions based on just this.
What don’t they tell us?
- They don’t say anything about whether the work was actually valuable or not. Is anyone using these features that we’ve just shipped? Are they getting value from that?
- They also don’t tell us if what we’re doing is sustainable over the long haul. The fact that we’re flowing the work in a certain way now, doesn’t prove that we’ll be able to still be able to do that a year from now.
Despite not giving us insights into those areas, flow metrics still do tell us quite a bit. I typically start with these four:
| Metric | Description |
|---|---|
| Work in Progress (WIP) | How many items have started but not finished? |
| Throughput | How many items have completed in a period of time? |
| Cycle time | How many days did it take for the work to move from started to finished. |
| Work item aging | How many days has it been since that work started? |

The first three are all components of Little’s Law which shows a relationship of averages. The last is a leading indicator for what the cycle time will be.
WIP and Aging are leading indicators. They’re places where we can make choices that will affect the system. We choose to start another piece of work when something else is already in progress. We choose to swarm on an item that is aging unnecessarily.
It’s worth calling out that WIP is the one metric that is most obviously a choice. Sometimes an item is blocked and there is no way to avoid having that item age. Choosing to start a new item and therefore increasing WIP is always a choice, no matter what the team might think.
Starting a new work item is a choice and is under your direct control. It is the only part of Little’s Law that is a choice.
Cycle Time and Throughput are lagging indicators. They tell us good information about the past activity of the system that may inform future decisions about upcoming work. We can learn from these so as to make better decisions in the future.
Aging and WIP are leading indicators. They provide information about what is currently happening in the system and allow us to make course corrections in real-time.
Aging and Cycle Time are for one specific work item, whereas WIP and Throughput are looking at data in aggregate; groups of work items, not just one.
With this mix of individual vs aggregated and leading vs lagging, we’re able to get a good view into our system so that we can make more data-informed decisions. We really want to keep an eye on all four so we can see how everything is interconnected.
If you’re using Jira then see our JiraMetrics tool to show all four of these metrics in a variety of ways.
For a more in depth look at these metrics, see our Flow Metrics Basics for Agile Teams course.
