I’ve released JiraMetrics 2.12, with a number of bug fixes, and a new chart that I’ll describe below.
If you’ve never heard of JiraMetrics, it’s a tool to extract useful information from Jira about your projects. I wrote this to satisfy my own need for metrics and have released it as open source (free) to help others. If you’ve attempted to use the default metrics in Jira, you’ll already realize how limited, and often misleading, they are.
The new chart is intended to be used during your daily coordination meeting (daily scrum, standup, etc). The problem it’s trying to solve is that many teams struggle to know what order to walk the items on the board.
We should be walking from most important to least important, to ensure we focus our attention to the right places. If we get to a point where we’ve already got enough work for the day, or the meeting has run out of time, we know that we’ve already talked about the most important items and the rest can wait for tomorrow.
Many teams have been mislead by the common scrum questions into thinking that we should be walking by person, and not by importance. This is wrong and serves to discourage collaboration. Note that those questions aren’t even part of the Scrum Guide anymore, and you definitely shouldn’t be using them.
Within each priority (class of service), we should be walking through the items from oldest to youngest, and Jira provides no way of seeing how old any given ticket is. It can tell you how long a ticket has been in its current column, but that’s not the same. So what most teams will do is walk the board right to left, top to bottom, as this is a reasonable approximation of age order. It isn’t perfect as items can move around others, but it’s often the best we have.
Many teams using Jira, will visualize both Stories and Sub-tasks on the board at the same time and so even if they’re walking the board right to left, they’re talking about the Story and the Subtask in different sequences.
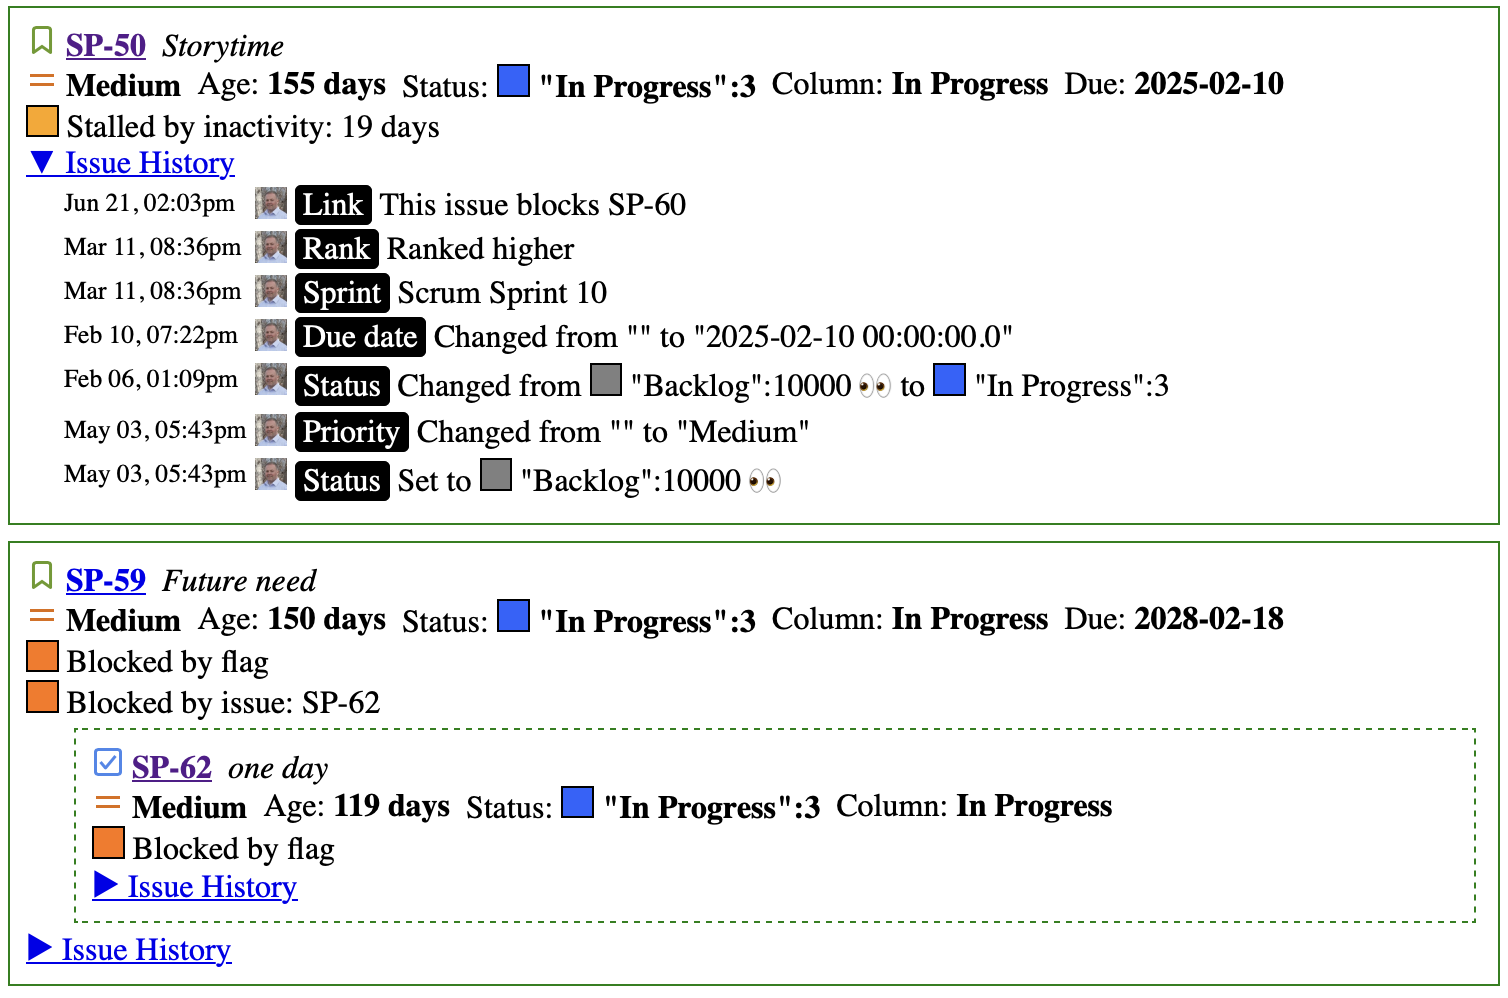
The point of the new chart is to show all the active items in the correct sequence, from most important to least, with all the information visible that we would need to discuss each one. If there are subtasks then they are grouped with their appropriate Story. If we’re blocked on another ticket then that ticket is visible here too. Do we need to look at the comments or what changes have been made to the ticket? That’s here as well.
If your team is using Jira then give this new chart a try and see how it improves your standups. If there is information that you want to see during your meeting that isn’t here then let me know that.