
Most companies I work with have a desire to track metrics for their development teams, and I support this. It’s hard to improve something we can’t see so metrics are a good first step as we seek to improve.
The problems are that:
- We tend to measure the wrong things.
- We often misinterpret the data.
I’ve seen cases at multiple companies where a person or group has been given the mandate to collect metrics with no understanding of what they should measure or why. These people almost never have any background in statistics and this is their first attempt to do anything meaningful with data.
I’m often asked to help these people and the first question I ask is “What decisions are you trying to make?”. We shouldn’t be collecting metrics just for the sake of doing that; we should be doing that in order to improve our ability to make decisions.
Far too often, they just don’t know what decisions need to be made as the people who will make the decisions are rarely the same people who have been asked to collect the data.
I have heard on multiple occasions: “Management told me to start tracking numbers but they gave me no indication why or how they would use the data.”
So they collect whatever data is easy to collect, put it into pretty charts that everyone pretends to be able to interpret, and we’ve wasted an opportunity to learn and improve.
What would be some examples?
- I recall one place where they graphed whether teams had a product owner (PO) or not. A boolean data point that was graphed in a nice line chart, that appeared to be trending upwards. When I dug into what they were really tracking, I discovered that the line was going up, simply because week over week, they were adding more teams to the data and every one of those teams had a PO. The chart looked pretty, but it told us nothing that was actionable. It was meaningless.
- Another common example is tracking “velocity” as the sum of story point values. Those story points are wildly inaccurate at an individual level and adding them up gives us a number that might appear meaningful but isn’t.
Sometimes we’ll measure one thing that is genuinely useful in one context but we’ll use it in a completely different way that is ineffective, and often counter-intuitive. For example, code coverage percentage is an excellent metric for a team to use to improve their own practices, but will be actively damaging if used in a management report. The moment the team thinks management is looking at it, they’ll game the numbers and we’ll lose any value they would have had.
So far, I’ve been talking about the bad news. What can we do that is genuinely useful?
- Understand what decisions you want to make.
- Find some complementary metrics that will inform you about the current state around that decision.
It’s important that you don’t pick just one metric as that never tells the entire story, and is easily gamed. We want multiple metrics that complement each other.
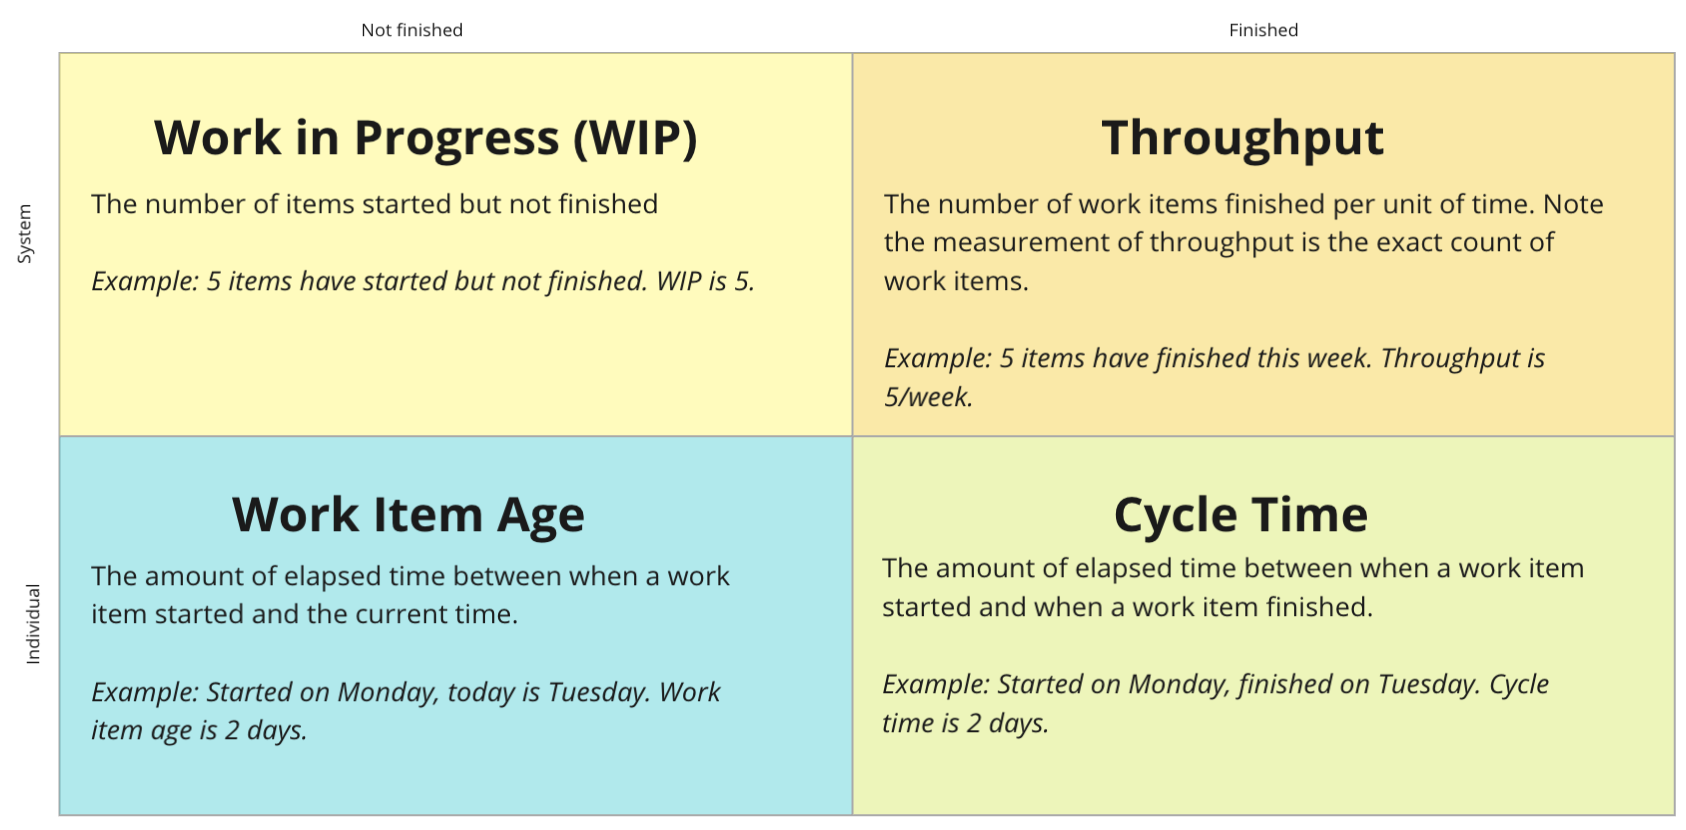
For example, let’s say that we want to improve the flow of work through a team. We want to collect information that will help us make decisions around that point. There are four metrics that I would start with and they directly complement each other.
- Work in progress (WIP): Total number of items that are started but not finished.
- Throughput: Total number of items that completed in a period of time.
- Cycle time: The number of days from start to done for a single item.
- Work item age: The number of days since this item started.
As you can see from the diagram below, two of these are leading metrics (WIP, age) and two are lagging metrics (Throughput, cycle time). Two tell us information about individual items (age, cycle time) and two tell us about patterns in the system (WIP, throughput). All four provide useful information that balance the others.
If we had only looked at cycle time and had ignored age, then the numbers would be very misleading as we would only know about things that are actually finishing and would miss things that were lingering for a long time.
The same for each of the other four metrics. If we only looked at one, we’d miss important information that could be found in the others.
I do encourage collection of metrics although it’s critical that we do so purposefully. Consider what decisions you want to make and collect those metrics that allow us to make effective decisions around that.
Shameless plug: If you’re using Jira then the JiraMetrics tool will help you get all kinds of good data in order to make more effective decisions. I’m the author of that tool and can help your company make better data-informed decisions. Let’s talk.