
Do your customers ever ask “When will it be done?” When dealing with the future, there’s almost never an accurate deterministic answer (Tuesday, exactly at 3:45pm) to that question but there is an accurate probabilistic answer (85% chance of completion on or before October 1) and in most cases, it’s a lot easier to calculate than you’d expect.
There are several different flavours of probablistic forecasting and we’re going to look at a couple of them.
- Using the service level expectation (for single items)
- Story level Monte Carlo simulation (for predicting many stories)
- Epic level Monte Carlo simulation (for predicting many epics)
- Reference class forecasting (for large blocks of work, such as new projects)
Many people use the terms probabilistic forecasting and Monte Carlo interchangeably, as if they’re the same thing, except they’re not.
Monte Carlo is certainly the most common way to create a probabilistic forecast, but it’s only one way of many.
For any kind of a probabilistic forecast, we have an assumption that the data is inherently predictable. This implies that we sliced the work appropriately in the first place and then took steps to make sure the data quality was maintained.
If our historical data is unreliable then it doesn’t matter what kind of model we use, the result will also be unreliable.
Service Level Expectation
If we only have one item that you want to forecast then we can just use the Service Level Expectation (SLE) for the system. In the example below, 85% of the items completed in nine days or less and that’s our SLE. If we want to determine how long a single item will take and we’re able to start immediately then we can say that with 85% certainty, we’ll be done in nine days or less.
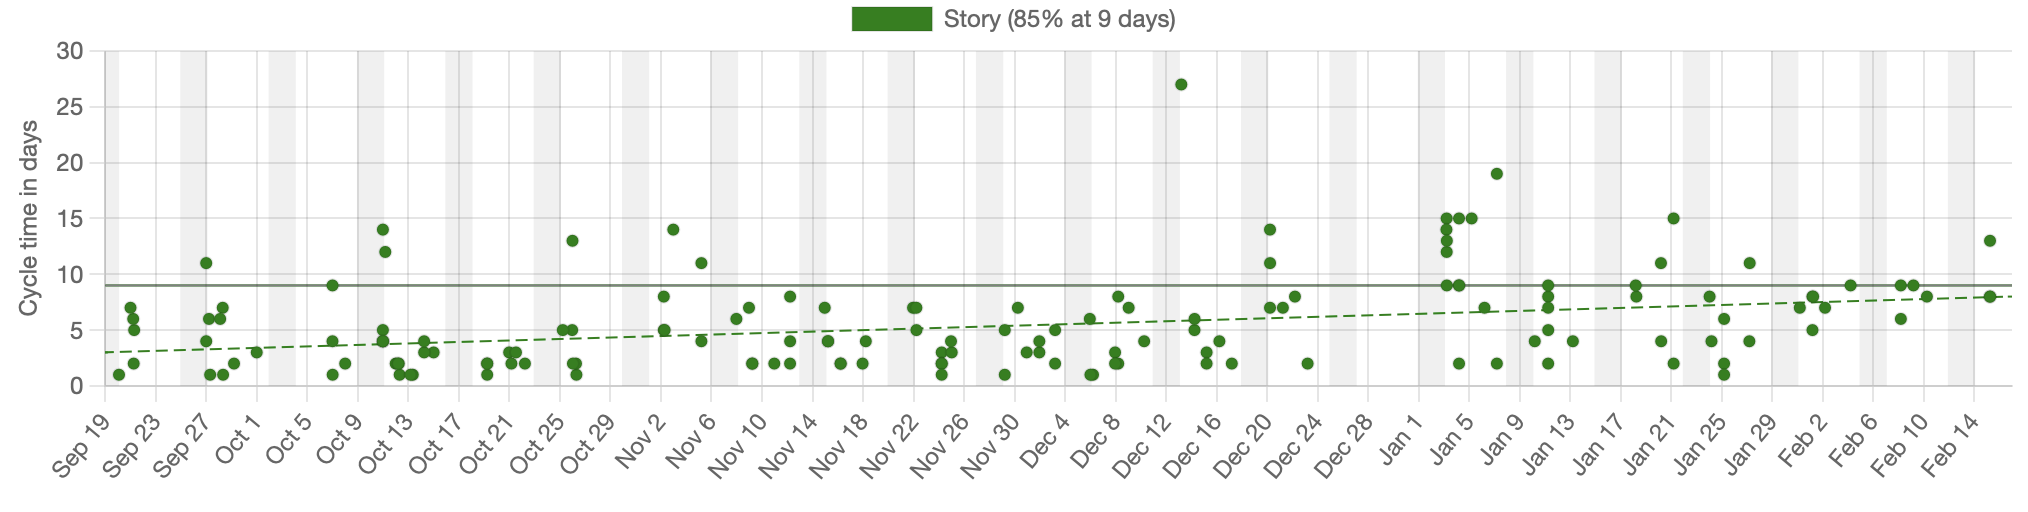
In this example, we’re looking at the SLE for a story, although we could have just as easily done that for an Epic or other type of work, assuming we’ve sliced that work appropriately.
This is the fastest way to get a forecast but is limited by the fact that it only works for a single item and also assumes that we can start the work right away. If we have many items to forecast, which is the more common case, we need to look at something more complex, such as a Monte Carlo simulation.
Story level Monte Carlo simulation
A Monte Carlo simulation uses large numbers of simulated outcomes to determine the likelihood of a thing happening. There are two common cases that we can solve for with this approach.
- We have a hundred items to do and want to know how long it will take to complete them
- We have a release date already promised and want to know how much work we can fit before that date.
The approach works by running thousands of simulated runs and looking at how often each one occurs, as shown in the diagram below. If we run the simulation a 1000 times and 800 of those simulated runs complete on or before October 1 then we can state that we have an 80% (800/1000) chance of completing on or before that date.
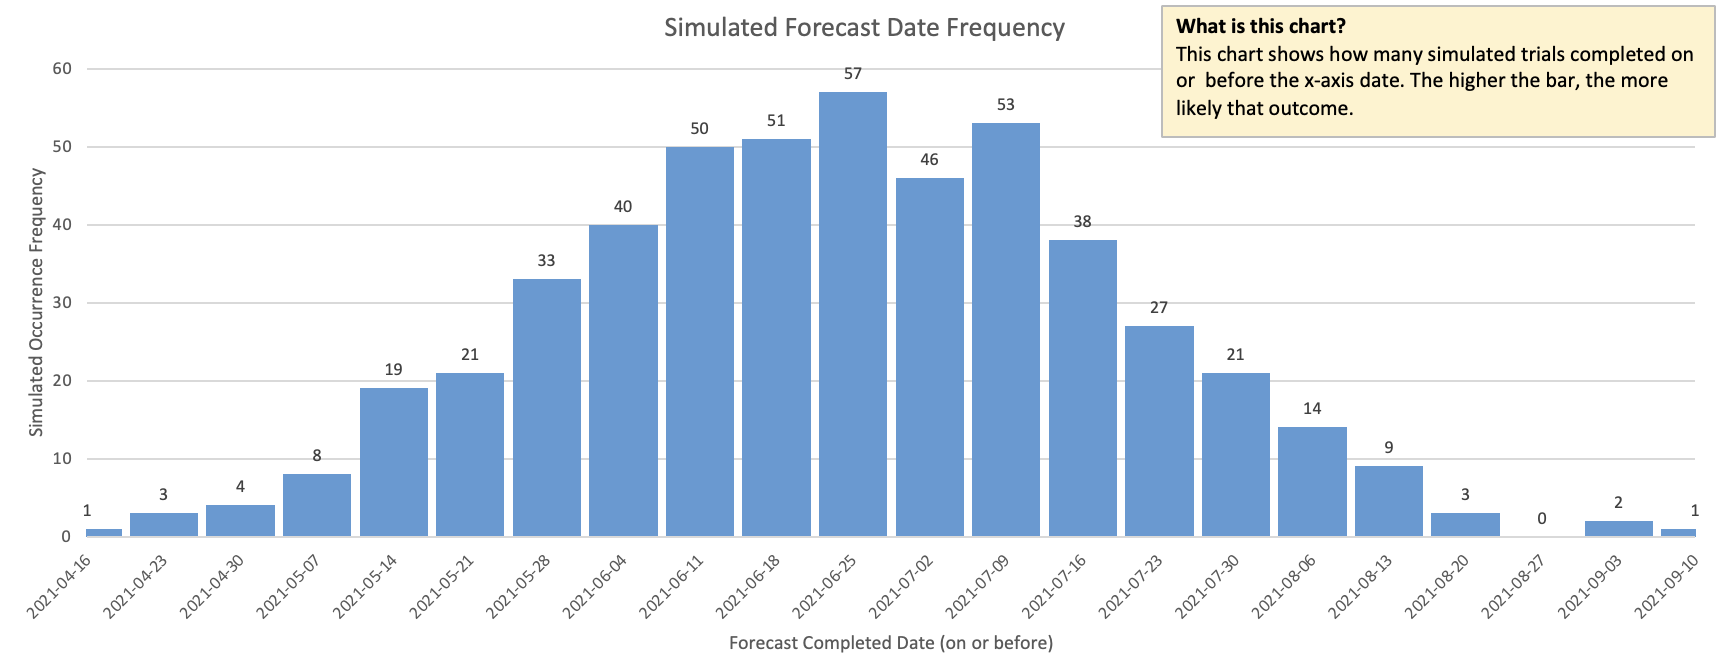
While individual simulation runs are largely unpredictable, we start to see patterns emerge as we run thousands of them together and aggregate the results. These patterns turn out to be highly accurate predictors of future performance.
There are tools1 that will run all of these simulations in seconds so this is an extremely easy way to generate a probabilistic forecast across many items. As this is so quick to do, we encourage you to redo the forecast regularly to see how we are tracking. In the same way that we continually update a weather forecast with new information, we want to do the same here.
Epic level Monte Carlo simulation
We are sometimes asked to make predictions about large pieces of work for which we know very little. Decomposing those large items into small enough stories to do the Monte Carlo that we discussed above is a significant amount of up-front work that may not be justified.
The good news is that we can do a Monte Carlo on epics or other larger types of stories, assuming that we’ve been slicing our epics well. A Monte Carlo simulation can be easily done at an epic level and decomposing our large work into epics isn’t nearly as daunting an effort as splitting into stories would have been.
The problem is that most companies have not traditionally split their epics well and so the data that we would need to do the Monte Carlo is flawed and we are left with a garbage-in, garbage-out scenario.
How would you know if the data is good? Start by looking at how we group stories within the epics. If we’re using epics as collections of items, rather than as distinct units of value then they’ll be useless for a Monte Carlo simulation. See this this article on slicing epics for more on that.
If you want to know how a Monte Carlo simulation works under the covers, then see this article.
If our data doesn’t help with that, then we move on to reference class forecasting.
Reference class forecasting
Reference class forecasting is when we look for comparable work from the past, consider all the ways that historical work is both the same and different from the upcoming work, and create a forecast from that. There are some tricks to this and it does take some work to get a reasonable forecast, but it’s a good technique when you’re not in a position to do a Monte Carlo simulation.
See this other article that walks through reference class forecasting with examples.
Recap
Monte Carlo simulations are just one, of several ways, to do a probabilistic forecast. Which approach you take will depend on what information you have available and what you need to know.
-
The two Monte Carlo tools I use most often are the Throughput Forecaster from FocusedObjective.com (look under free tools) and Actionable Agile from 55 Degrees. You can’t go wrong with either one of these. ↩